

WinPlot 9.0
Creates, manages and edits 2D and 3D graphs
Program info
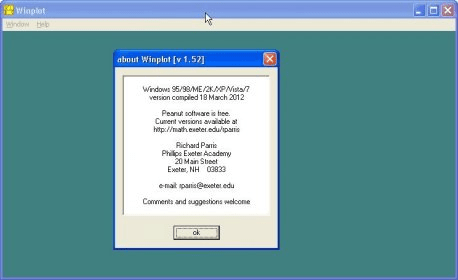
Create visual representations of various math formulae by automatically drawing 2D and 3D graphs based on the input data you require including coordinates, tables, axis scale or labels. Equations are estimated or generated randomly. Function definitions are limited to 255 characters.
Winplot is a general-purpose plotting utility, which can draw (and animate) curves and surfaces presented in a variety of formats.
Each menu has its own help file. The following are general remarks:
Text input is not case-sensitive.
Function definitions are limited to 255 characters.
Some dialog boxes are permitted to stay on the screen indefinitely. They can be closed by clicking a button named “close”, or by pressing Esc.
Details
Extensions

No information available
The data will be available later.


Comments